Homepage › Solution manuals › Yaser Abu-Mostafa › Learning from Data › Exercise 3.2
Exercise 3.2
Answers
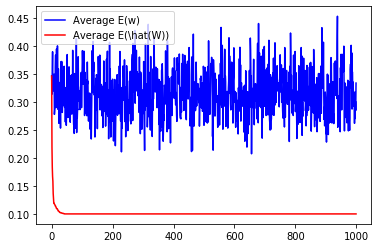
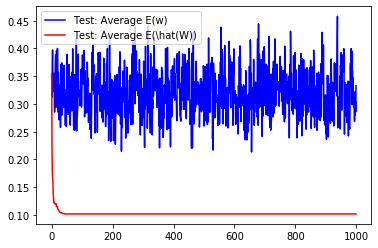
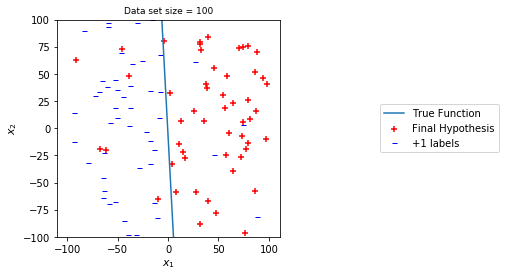
lb, ub = -100, 100
N, dim = 100, 2
num_grid_points = 2000
coeff_lb, coeff_ub = -10, 10
eta = 1
maxit = 1000
test_N = 1000

randomized, print_out = True, True
x1 = np.arange(lb, ub, 0.01)
true_func, rn_func, norm_coeffs = get_true_random_funcs(N, dim, num_grid_points,
                                           lb, ub, coeff_lb, coeff_ub)
df = generate_df(N, dim, true_func, rn_func)
test_df = generate_df(test_N, dim, true_func, rn_func)

flips = np.random.randint(N, size=(int(N/10), 1))
df.iloc[flips.flatten(), -1] = -df.iloc[flips.flatten(), ]['y']
plot_data(x1, df, norm_coeffs, None, lb, ub)

flips = np.random.randint(test_N, size=(int(test_N/10), 1))
test_df.iloc[flips.flatten(), -1] = -test_df.iloc[flips.flatten(), ]['y']

avg_w_ts, avg_what_ts = np.zeros(maxit), np.zeros(maxit)
avg_test_w_ts, avg_test_what_ts = np.zeros(maxit), np.zeros(maxit)
K = 20
for it in range(K):
    w, w_ts, what_ts, test_w_ts, test_what_ts, _ = lm.pocket_algo(df.values,
                                                                 dim,
                                                                maxit,
                                                                eta,
                                                                randomized,
                                                                print_out,
                                                                test_df.values)

    #print(w_ts.shape, what_ts.shape, test_w_ts.shape, test_what_ts.shape)
    avg_w_ts += w_ts
    avg_what_ts += what_ts
    avg_test_w_ts += test_w_ts
    avg_test_what_ts += test_what_ts

plt.plot(np.arange(len(avg_w_ts)), avg_w_ts/K, 'b', label='Average E(w)')
plt.plot(np.arange(len(avg_what_ts)), avg_what_ts/K,
         'r', label='Average E(\hat(W))')
plt.legend()
plt.show()

plt.plot(np.arange(len(avg_test_w_ts)), avg_test_w_ts/K,
         'b', label='Test: Average E(w)')
plt.plot(np.arange(len(avg_test_what_ts)), avg_test_what_ts/K,
         'r', label='Test: Average E(\hat(W))')

plt.legend()
plt.show()
final Error Rate:  0.1
final normalized w: [-0.64483871 19.90322581  1.        ]
final Error Rate:  0.1
final normalized w: [-1.77688889 14.46666667  1.        ]
final Error Rate:  0.1
final normalized w: [-0.35070175 20.          1.        ]
final Error Rate:  0.1
final normalized w: [ 2.16108108 11.54054054  1.        ]
final Error Rate:  0.1
final normalized w: [ 1.11055556 20.55555556  1.        ]
final Error Rate:  0.1
final normalized w: [ 1.31081967 15.08196721  1.        ]
final Error Rate:  0.1
final normalized w: [-0.24679012 14.61728395  1.        ]
final Error Rate:  0.1
final normalized w: [ 0.         15.76086957  1.        ]
final Error Rate:  0.1
final normalized w: [-0.2315444  9.8030888  1.       ]
final Error Rate:  0.1
final normalized w: [-0.71758974 10.96923077  1.        ]
final Error Rate:  0.1
final normalized w: [ 0.         19.32352941  1.        ]
final Error Rate:  0.1
final normalized w: [-0.10357513 11.29015544  1.        ]
final Error Rate:  0.1
final normalized w: [ 0.         17.18604651  1.        ]
final Error Rate:  0.1
final normalized w: [-4.18395349 12.20930233  1.        ]
final Error Rate:  0.1
final normalized w: [ 1.08472868 17.54263566  1.        ]
final Error Rate:  0.1
final normalized w: [0.35070175 9.68421053 1.        ]
final Error Rate:  0.1
final normalized w: [-0.35696429 11.17857143  1.        ]
final Error Rate:  0.1
final normalized w: [ 0.20608247 12.08247423  1.        ]


final Error Rate:  0.1
final normalized w: [-0.47595238 16.42857143  1.        ]
final Error Rate:  0.1
final normalized w: [ 1.05210526 11.21052632  1.        ]